
What Is a P&I Flow Diagram?
A P&ID (Piping and Instrumentation Diagram), also known as a P&I flow diagram, is a detailed diagram in plant and process engineering. It is used to illustrate the technical realization of a process or procedure. Graphic symbols are used to illustrate the various system components such as apparatus, machines, pipelines, valves, fittings and measurement and control technology (MCR technology).
The P&I flow diagram is a detailed and comprehensive representation of the technical components and connections of a system. It shows all important equipment, machines, pipelines and the associated I&C technology. This includes
- Apparatus and machines: The function, type and identification, including drive machines and conveying equipment, are shown.
- Pipelines: Information on nominal diameter, pressure rating, material and design of pipelines, often specified by pipeline numbers and classes.
- Valves and fittings: representation of valves, transition pieces and other fittings.
- Process control technology: symbols and designations for I&C tasks, regulation and control functions.
Important functions of the P&I flow diagram:
- It is a central document for the planning, construction, installation and operation of a system.
- It supports the exchange of information between the people involved in the development, construction, operation and maintenance.
- It serves as the basis for preliminary planning (basic engineering) and defines the tasks for the individual specialist departments.
The basic information in a P&ID includes the most important technical data, such as the type and function of the equipment, piping specifications and symbols for the process control technology.
Additional information may include flow paths, flow rates, material specifications and position information for the system components.
The P&ID is indispensable for the complete technical documentation, that is required for the commissioning and maintenance of systems. It contains the highest density of information compared to other flow diagrams and is an essential tool for the efficient and safe operation of a system.
What Norms and Iso Standards Are There?
Here you will find a comprehensive overview of the relevant standards and ISO standards related to P&I flow diagrams and P&I flow charts that you should know:
Basic ISO standards for P&I flow diagrams:
- ISO 10628-1: This standard defines the requirements for P&I flow diagrams and includes both basic and additional information. Basic information includes the function and type of equipment, machines, pipelines, valves as well as their identification and essential data. Additional information can include information on energy flows, materials and platform heights.
- ISO 10628-2: This classifies the graphic symbols into different groups according to their functional and graphic characteristics in order to ensure a standardized representation.
- ISO 7200: This standard specifies the basic font for plans and lists, which is also used for P&I flow diagrams.
- ISO 81714-1: Regulates the line widths that are used for a clear representation in technical drawings. Main flow lines are emphasized by larger line widths.
- ISO 3098-2: Specifications for labeling in technical drawings.
Other relevant standards:
- DIN EN ISO 10628: (formerly DIN 28004) Flow diagrams for process plants - General rules.
- DIN 2429-1 and DIN 2429-2: These standards relate to graphic symbols for pipelines and their functional representation.
- DIN 19227: These standards cover control technology, in particular the graphic symbols and code letters for process control technology.
- DIN 6779: Labeling system for technical products and technical product documentation, often used in chemical plants and power plant construction.
- DIN EN 60617: (formerly DIN 40900) Graphic symbols for circuit diagrams, important for technical drawings in electrical engineering.
Special labeling standards:
- KKS (power plant labeling system): Widely used in power plant construction and chemical plants, for labeling apparatus, piping and instruments.
- ISA 5.1: American standard for process drawings in which instruments are labeled according to physical function rather than electrical function. For example, “F” stands for flow and “P” for pressure.
Special notes:
- P&I flow diagrams can be created in accordance with the withdrawn DIN 2924 or the current DIN 28000-4, in particular for the representation of actuators.
- EI&C tasks are represented in accordance with DIN 19227.
Important graphic representations and requirements:
- Apparatus and machines must be represented approximately to scale and relative to each other in their height position.
- Symbols for measuring, control and regulating devices as well as pipelines and fittings must be shown in their logical position.
These norms and standards ensure that P&I flow diagrams and flow charts in process engineering are presented in a uniform and comprehensible manner worldwide. Follow these guidelines to create consistent and standard-compliant technical drawings.
What Does a P&I Flow Sheet Consist Of?
An P&I flow chart consists of various standardized display types, which form the basis for the detailed presentation of process management and the associated automation technology. In particular, the following standardized display types play a decisive role:
- Basic flow diagram: This describes the basic flow of a process and shows the most important process steps and equipment schematically, but without detailed information about pipelines or instrumentation.
- Process flow chart: It is based on the basic flow diagram and shows in detail the arrangement of the devices and the connections between them. Key process parameters such as pressure, temperature and material flows are also recorded here. The process flow diagram provides the basis for the P&I flow diagram.
- Electrical measurement, control and regulation technology (EMSR): The P&I flow diagram supplements the process flow diagram by involving the EMSR offices. This includes all sensors, actuators, control and regulation circuits that are necessary to automate and monitor the process. This technology enables precise control and regulation of process conditions.
Basic Flow Diagram
A basic flow diagram (also known as a block flow diagram) is a simplified presentation of a process or a process engineering plant. In this illustration, rectangles are used to represent process stages, basic operations, process engineering plants or plant components. These rectangles are connected by lines or arrows, which indicate the flow of substances, energy, or energy carriers.
A basic flow diagram also contains the names of the input and starting materials (starting materials and products). In addition, information such as material flows, energy carriers, flow rates and characteristic operating conditions (such as pressure, temperature and concentrations) can be provided.
The basic flow diagram forms the basis for more detailed representations, such as the P&I flow diagram. It represents the basic structure of a process, which is then further refined in the P&I flow diagram.
Process Flow Chart
A process flow chart, also known as a process flow diagram (PFD), is a graphical presentation of a process or a process engineering plant. It shows how the process works by representing the main plant components, such as apparatus and machines, as well as their connections. Graphic symbols represent the various plant components, and lines symbolize the flow paths of substances and energies.
Basic information
The process flow chart contains the following essential information:
- Apparatus and machines: All equipment required for the process is presented and marked with icons in accordance with EN ISO 10628.
- Flow paths and flow directions: The paths and directions of the input and output materials as well as the energies (e.g. heat, electricity) are specified.
- Flows and quantities: The quantities of input and output materials as well as the energy flows are recorded.
- Energy types and carriers: The type of energy used, such as steam or electricity, is specified.
- operating conditions: Important operating data such as temperature, pressure or other characteristic conditions are documented.
Additional information
In addition, the process flow chart may contain the following information:
- Intra-plant material and energy flows: Quantitative information on the substances and energies within the process.
- Essential fittings: Representations of valves, sight glasses or rupture discs that are important for operation.
- Measurement and control technology: Information on the measurement and control technology used in accordance with ISO 3511.
- Operating conditions and device sizes: Further details on operating conditions as well as information on the size and altitude of the equipment and machines.
The process flow diagram is one of the most important planning documents in process engineering. It is not only used to document the physical and chemical functions of a plant, but is also central for planning, operation, expansion and communication between various specialist departments.
Compared to the P&I flow diagram, the process flow chart focuses on a more comprehensive overview of the process and the main components of a plant. The P&I flow diagram is based on the information from the process flow chart and further specifies it, in particular with regard to technical implementation and control.
Electrical Measurement, Control and Regulation Technology (EMSR or PLT)
Electrical measurement, control and regulation technology (EMSR or PLT) is a technical and scientific field that has established itself as a central component of automation technology and electrical engineering in particular. It comprises of three closely linked disciplines: measurement technology, control technology and control engineering. These areas are crucial for automating processes in industry, as they enable the recording, processing and control of process variables.
Measurement technology: This is about obtaining information about a real measurement object. This can be done by measuring electrical and non-electrical quantities such as current, voltage, temperature, pressure, or pH value. The captured data are usually converted into electrical signals, which are then further processed, for example to evaluate the measurement values or as a basis for control and regulation processes.
Control technology: Control technology is about forcing certain processes in a controlled process. This means that a process is specifically influenced to achieve the desired result, for example by switching machines on or off or adjusting process parameters.
Control engineering: Control technology has the task of stabilizing or managing processes so that they remain largely independent of external disturbances. This is done by continuously adjusting the process parameters in order to meet the desired target values.
In a P&I flow diagram, the tasks of EMSR technology are decisive. The P&I flow diagram is created by adding the EMSR tasks required to automate the process to a process flow chart. EMSR offices, which are also referred to as process control units (PCT offices), are entered here. These points are the intersections where measurements are carried out and control and regulation tasks are carried out in order to operate the process efficiently and stably.
Design and Graphical Implementation of a P&I Flow Diagram
In accordance with the ISO 10628-1 standard, there are clear requirements for the structure and drawing of P&I flow charts:
Design of an P&I flow diagram
- Sheet size and title field: The recommended sheet size is A1 in accordance with ISO 5457. The title block must be designed in accordance with ISO 7200, using the basic title field for plans and lists with additional fields.
- Presentation of devices and machines: Apparatus and machines are presented relative to their altitude and approximately true to scale in their outer main dimensions. This means that devices that are actually positioned at the top of the plant are also shown at the top of the P&I flow diagram.
- Line widths: Different line widths in accordance with ISO 81714-1 improve clarity. Main pipelines and main flow lines must be emphasized by larger line widths.
Illustrative implementation of a P&I flow diagram
- Flow direction and connection: The main flow direction is typically from left to right and from top to bottom. Incoming and outgoing flows are represented with corresponding arrows and reference points (e.g. “tank farm (drawing number)”). The direction of flow within the system is marked by arrows in the lines. When crossing pipes, make sure that the vertical line or the thinner pipe is interrupted if there is no connection.
- Lettering: According to ISO 3098-2, the lettering is carried out exclusively in capital letters, with the exception of chemical formulae and abbreviations of regulations. There are defined font sizes for naming devices, machines and other labels.
Supporting Documents for P&I Flow Diagrams
An P&I flow chart includes various accompanying documents, which are essential to explain all relevant details and technical specifications. These accompanying documents are crucial to ensure that the flow diagram is understood and implemented. Key accompanying documents include:
- Process flow charts (PFDs): A process flow diagram is the basis for the P&I flow diagram. It presents the individual steps of a process in chronological order. This includes the sequence of functions, incoming and outgoing materials or services (inputs and outputs), necessary decisions, people involved, the time required for the individual processes and relevant process measurements.
- Piping Material Specifications (PMS): This specification provides detailed information about the construction materials, gaskets, screws and fittings used. It is an essential document that ensures that all materials used meet the required standards.
- Equipment and Instrumentation Specifications (EIS): This document provides detailed information that is too comprehensive to be included directly in the P&I flow sheet. It includes information on scope, standards, codes, specifications, definitions, terminology, building materials, design principles, mechanics and manufacturing, guarantees, tests and inspections, as well as documentation and shipping.
- Functional Requirement Specification (FRS): This document describes how the entire plant or system works. It contains important details about the functional requirements, communication, and scope of the process.
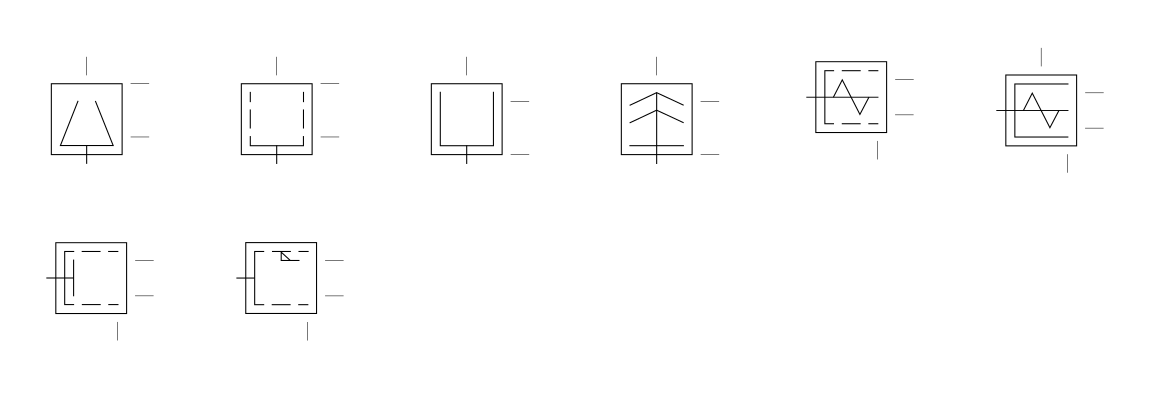
Graphic Symbols of an P&I Flow Chart
An P&I flow diagram (piping and instrumentation diagram) uses a variety of standardized symbols to represent various components and systems within a plant. These icons are divided into various categories, including equipment, pipes, vessels, heat exchangers, pumps, instruments and valves.
Devices


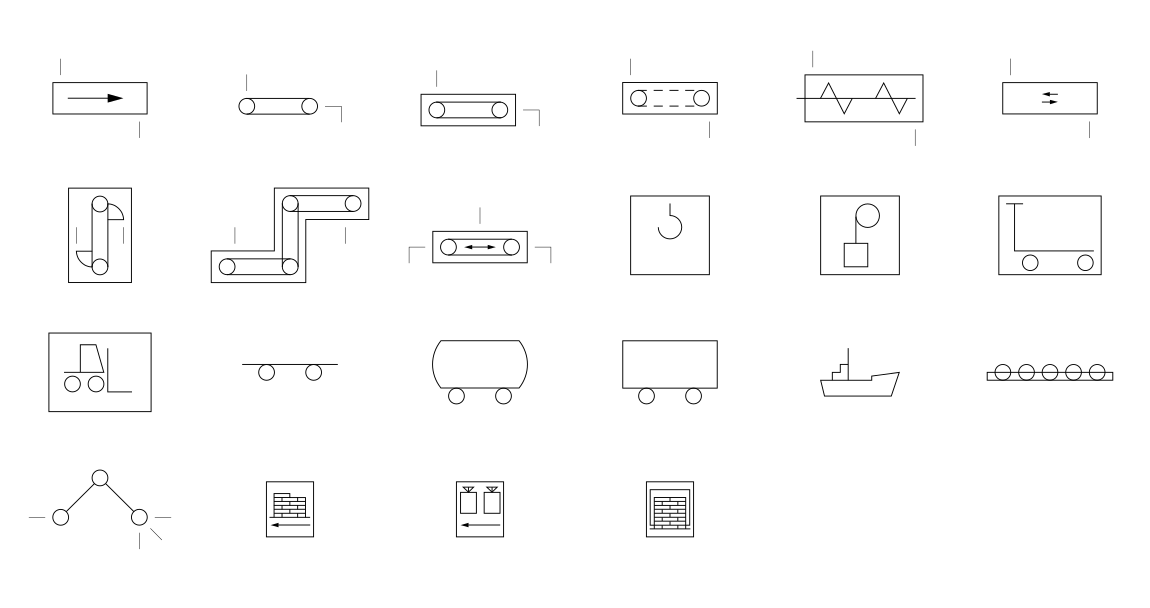


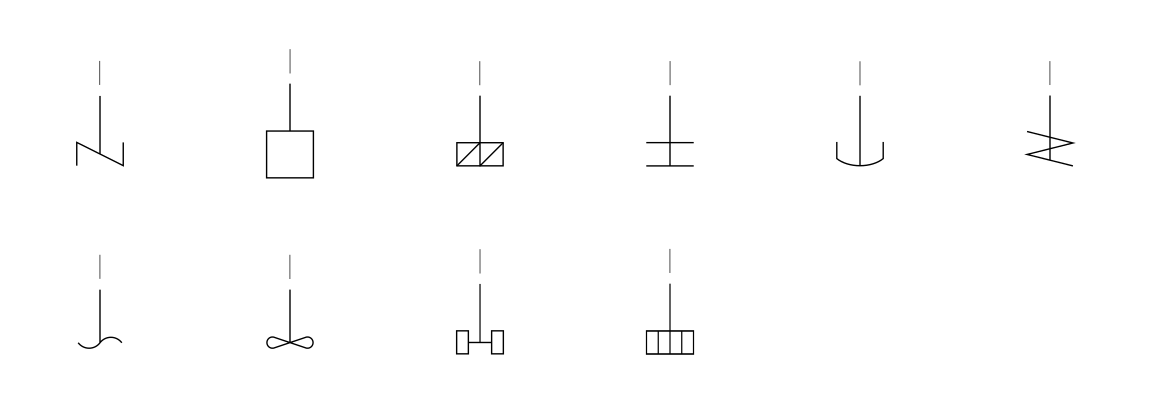
The category of equipment includes mechanical equipment and machinery that does not fall into the other categories. Typical symbols for devices in an P&I flow chart are:
- Compressors: Machines that compress gases.
- Conveyor belts: Systems that transport materials horizontally.
- Motors: Engines that provide mechanical energy.
- Turbines: Machines that are driven by flowing liquids or gases.
- Vacuum pumps: Devices that remove gases from a container to create negative pressure.
Piping
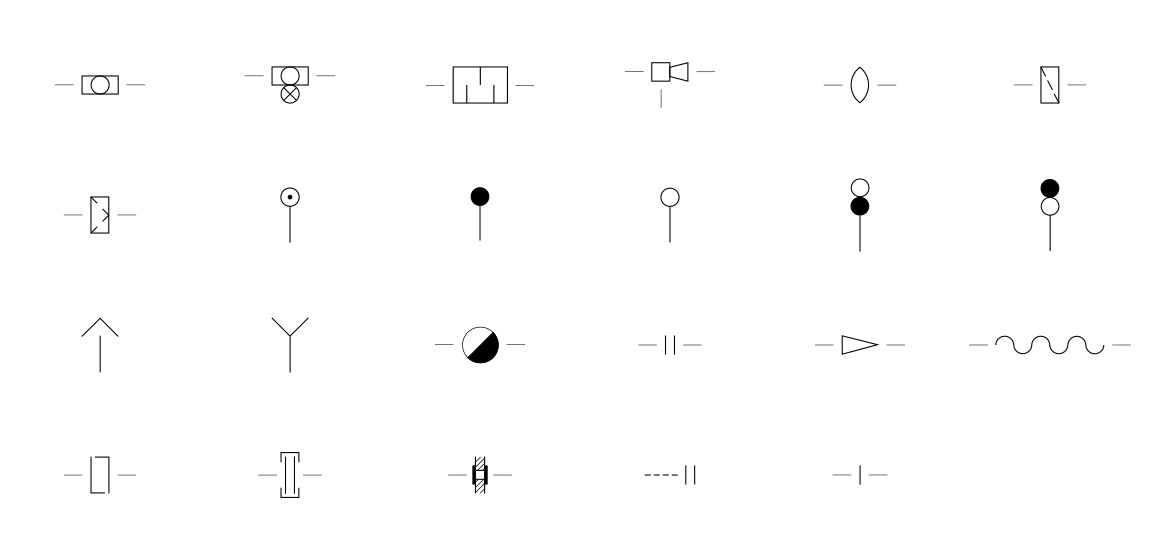

Pipelines are essential elements in an P&I flow diagram, as they enable the transport of liquid or gaseous substances. The symbols differ depending on the type and function of the pipeline:
- Straight pipes: Simple lines that represent the flow of substances.
- Forked pipes: Symbols that show the division of a river in multiple directions.
- Multi-line pipes: Representations of parallel pipelines that can carry different substances.
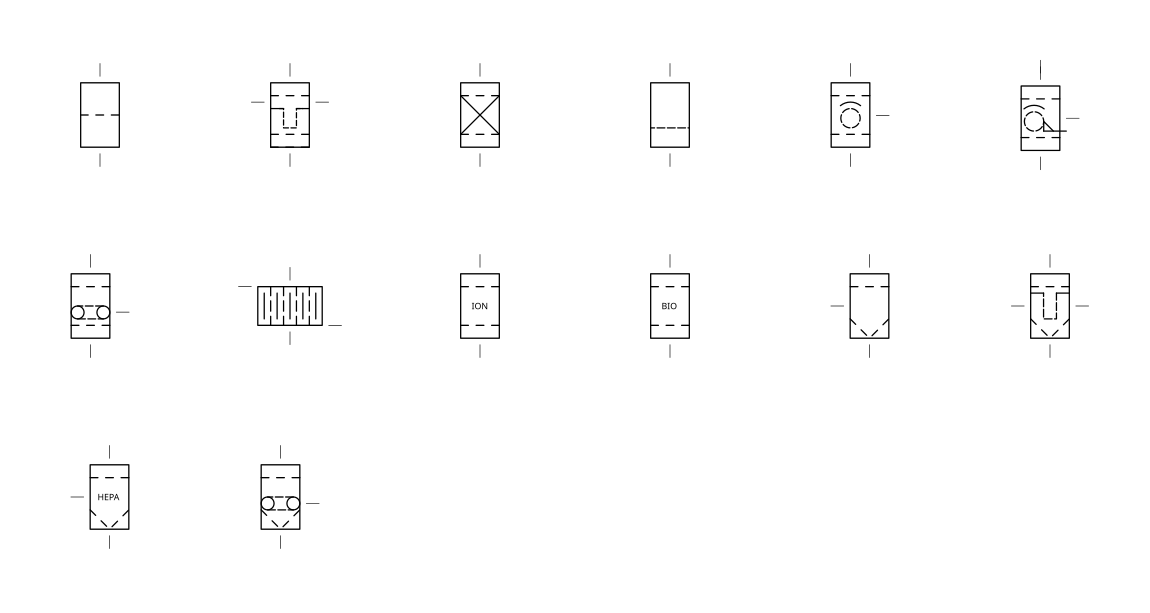
Receptacles

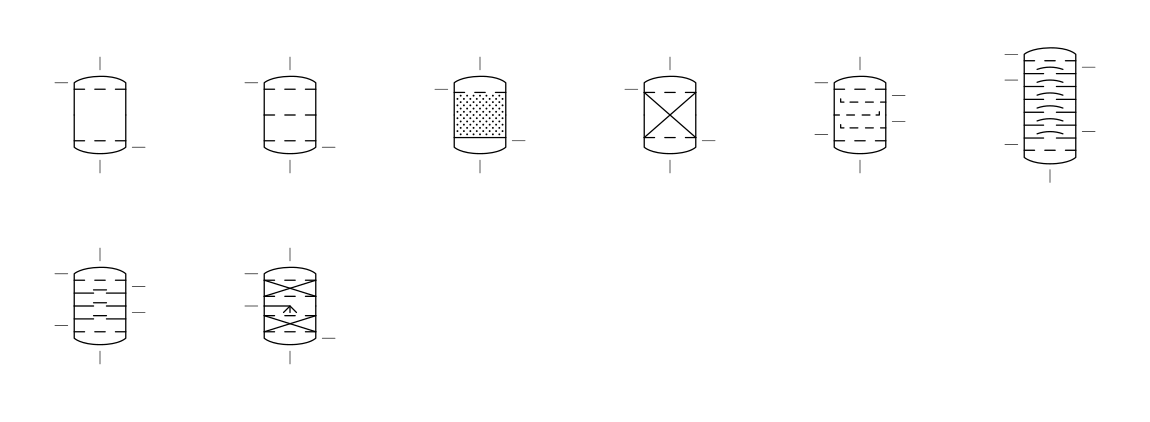


Containers are vessels that are used to store or treat liquids. Common containers in an P&I flow sheet include:
- Tanks: Cylindrical or rectangular symbols that are used to store large quantities of liquid.
- Silos: Special containers, often for storing bulk goods.
- Cylinder: Vertical or horizontal containers for storing liquids or gases.
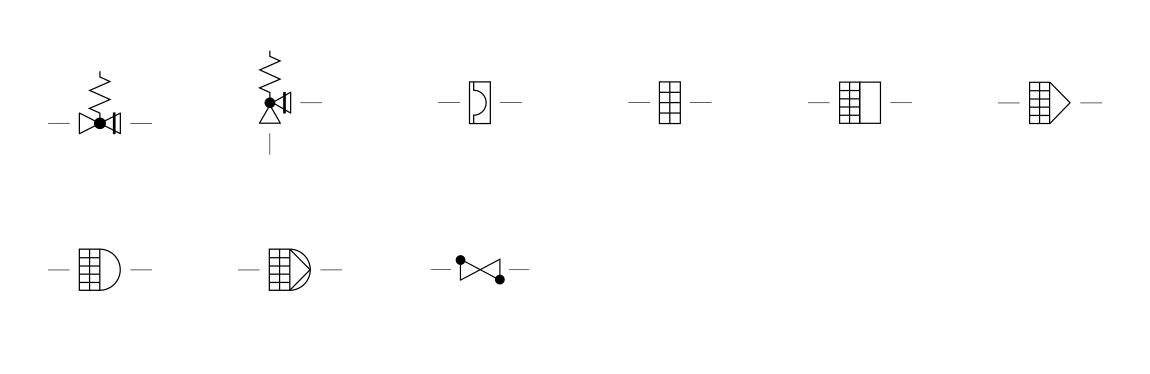
Heat Exchanger
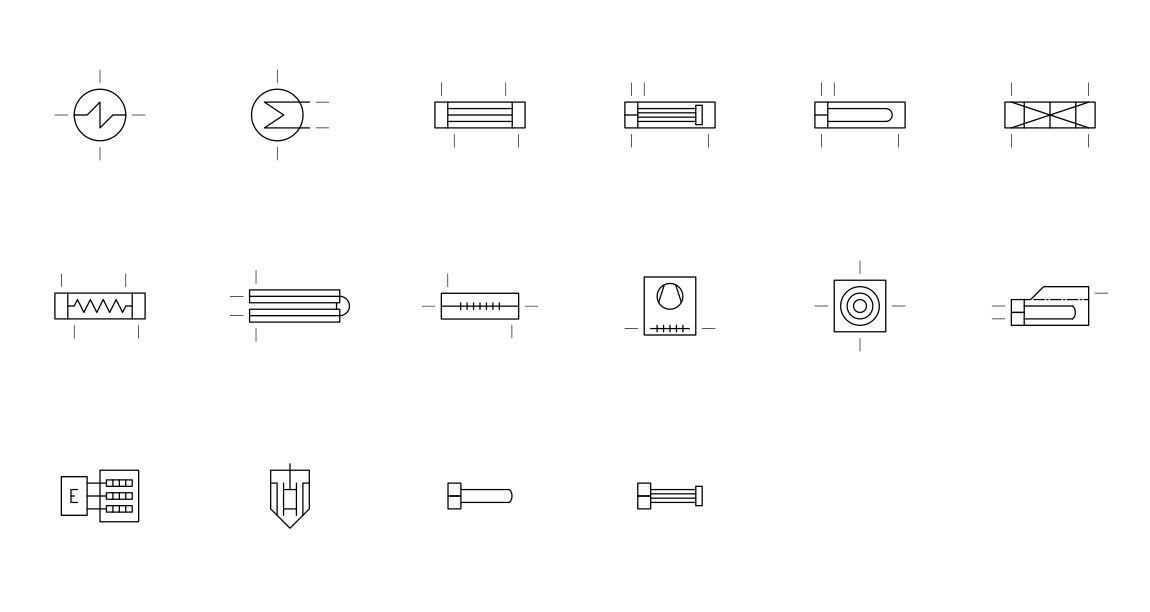


Heat exchangers are devices that transfer heat between various media. The symbols for heat exchangers include:
- Boiler: Steam generation devices represented by special rectangular symbols with internal serpentine lines.
- Capacitors: Heat exchangers that convert steam into liquid, often represented by symbols with condensation lines.
- Hose reels: Symbols that indicate the compact arrangement of pipes.
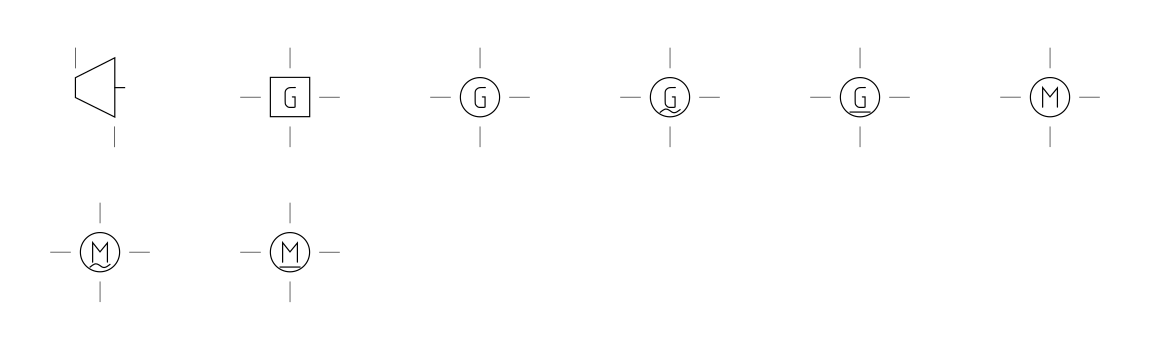
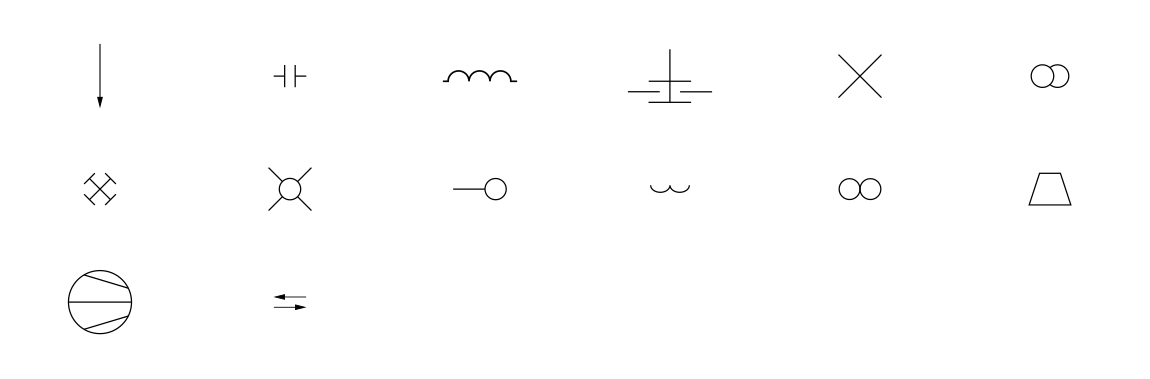
Pumps
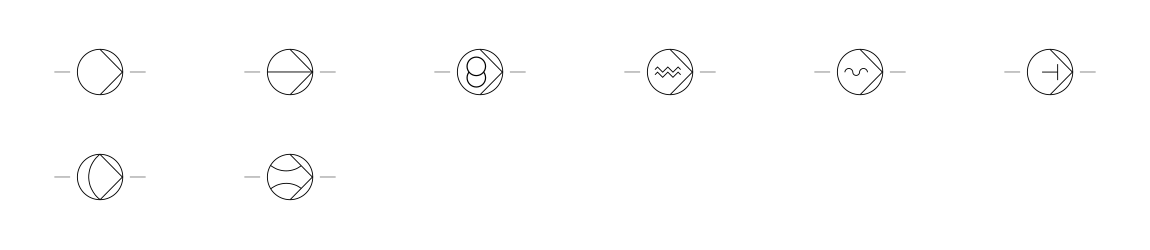
Pumps are used to increase the pressure of liquids or to transport them through the system. The most important symbols in this category are:
- Centrifugal pumps: Round symbols with an arrow that indicates the direction of rotation.
- Positive displacement pumps: Rectangular symbols that represent the mechanical process of displacement.
- Blower: Symbols used for fans or ventilators, often with paddle wheel representations.
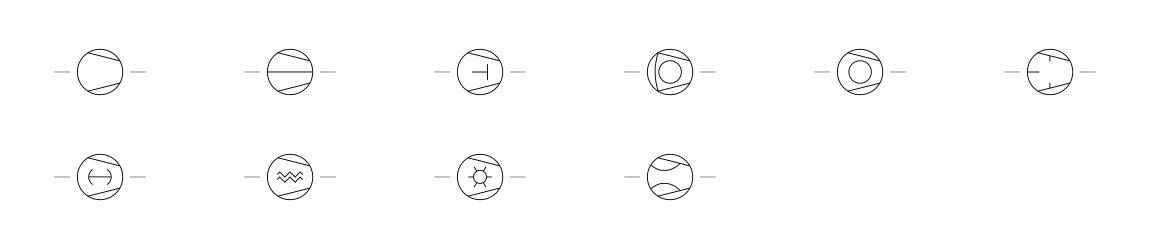
Instruments

Instruments in an P&I flow diagram measure and control various process parameters. Typical symbols include:
- Flow meter: Round icons with a central arrow that shows flow.
- Temperature indicator: Symbols that are often represented with a thermometer.
- Pressure transmitter: Rectangular or round icons with specific markings for printing.
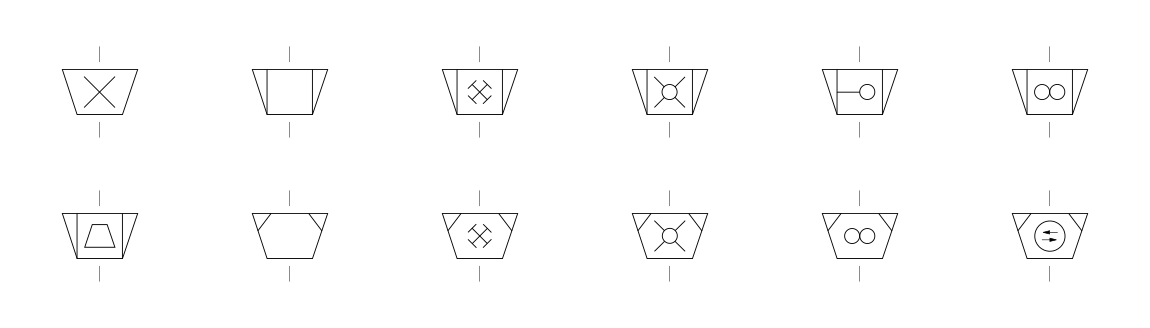
Valves
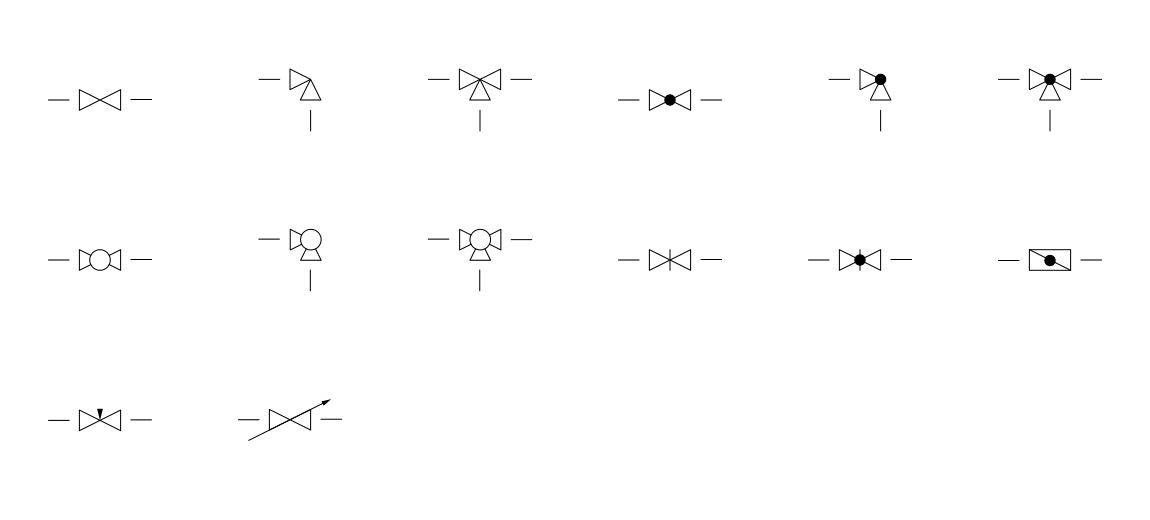

Valves control the flow of liquids or gases by opening or closing pipeline systems. The most important valve symbols include:
- Ball valves: Round icons with an inner dot that represents the ball valve mechanism.
- Spool valves: Icons that represent linear opening and closing.
- Rotameter: Special valve symbols used to measure flow, often represented by a vertical scale.
Measurement and Control Point Abbreviations
In an P&I flow diagram (also known as a P&I flow diagram), measurement and control points are identified by specific abbreviations. These abbreviations consist of a combination of letters and numbers that describe the type of measurement, its function and the monitoring or control task.
These abbreviations provide a quick and standardized way to identify the various measurement and control tasks in an P&I flow diagram. The letter sequences help to understand the type of measurement variable, the purpose of the measurement and the type of control or monitoring.
A measuring point abbreviation consists of several components:
- First letter: This letter indicates the measurement variable that is being monitored or controlled.
- Supplementary letter: This optional letter specifies the type of measurement or a particular condition.
- Sequential letter: This letter describes the function of the instrument, e.g. whether it only displays, controls or alarms.
First letter
- F: Flow
- L: Level
- P: Pressure
- T: Temperature
- H: manual operation (hand)
- Q: Quality
- D: Density
- M: Moisture
- S: Speed
- V: Viscosity
- W: Weight
Supplementary letter (optional)
- D: Difference
- F: Ratio
- I: Current value or display value (Indicating)
- Q: Current total, e.g. total quantity
Sequential letter
- A: Alarm (Alarming)
- C: Control
- I: Indicating
- R: Recording
- S: Switch or circuit (Switching)
- Y: Emergency
- H: Hand operation (manual)
- +: Upper limit (High)
- -: Lower limit (Low)
Illustrating examples
- TI101: Temperature display
- LIC102: Level control with display
- PSH103: Pressure switch with alarm function at upper limit
- FIC104: flow control with display
- PDIT105: Differential pressure indicator
- LIA106: Level indicator with alarm function
- TSH107: Temperature switch at high temperature (upper limit)
- FQI108: Display of the total quantity flowed through
Examples of Pipeline and Instrument Flow Diagrams
- Water heating process
- Power generation system
- Evaporator system
- Airconditioning
- SCR dust reduction system
Applications for Creating P&I Flow Charts
To create P&I flow charts (piping and instrumentation diagrams) in plant engineering, specialized applications from the area of Computer Aided Engineering (CAE) are used. These software solutions offer standardized symbols, assist with correct placement and ensure that the marking complies with current standards. The data is stored centrally in databases, which makes subsequent evaluation easier.
Examples and evaluation of applications for P&I flow charts
- AutoCAD P&ID (Autodesk)
- Advantages:
- User-friendly interface, particularly for users who already have AutoCAD experience.
- Extensive customization options for icons and layouts.
- Wide distribution and wide user community.
- Disadvantages:
- Limited functionalities compared to more specialized P&ID tools
- Performance may be limited for larger projects.
- Advantages:
- Engineering Base Instrumentation (Aucotec)
- Advantages:
- Integration with other modules of the Aucotec platform.
- Central data management for all project data.
- Flexibility when customizing the user interface.
- Disadvantages:
- Complex user interface that requires lengthy familiarization
- High costs for licenses and training.
- Advantages:
- Comos P&ID (Innotec)
- Advantages:
- Seamless integration with Siemens PLM systems.
- Comprehensive libraries for P&I flow diagram symbols.
- Strong support for automating processes.
- Disadvantages:
- High complexity that requires more specialized training.
- Licensing costs can be high for smaller companies.
- Advantages:
- AutoPlant P&ID (Bentley Systems)
- Advantages:
- Good integration with other Bentley products, ideal for large projects
- Supports the creation of detailed and complex P&I flow charts.
- Disadvantages:
- High costs and complex implementation.
- Training time required to use the full potential of the software.
- Advantages:
- PlantSpace P&ID (Bentley Systems)
- Advantages:
- Particularly suitable for large projects.
- Detailed reporting and evaluation tools.
- Disadvantages:
- Requires powerful IT infrastructure.
- Longer learning curve due to comprehensive features
- Advantages:
- SmartPlant P&ID (Intergraph)
- Advantages:
- Highly detailed and accurate P&ID creation.
- Automated checks for consistency and standards.
- Powerful data management tools.
- Disadvantages:
- Very high costs and complex implementation.
- Special knowledge required for effective use.
- Advantages:
- VPE P&ID (AVEVA)
- Advantages:
- Strong integration with AVEVA's comprehensive engineering platform.
- Efficient data management and reporting.
- Disadvantages:
- Very specific application that may be too complex for general tasks.
- High license and operating costs.
- Advantages:
- VISUAL PLANT ENGINEER (X-VISUAL TECHNOLOGIES)
- Advantages:
- Intuitive user interface with drag-and-drop functionality.
- Flexible adjustments for specific projects.
- Cost effective compared to other solutions
- Disadvantages:
- Less extensive in functionality compared to larger software packages.
- Can reach limits when it comes to very complex projects.
- Advantages:
Frequently Asked Questions About P&I Flow Diagrams
What Is the Difference Between a Process Flow Diagram (PFD) and a Pipeline and Instrument Flow Diagram (Pid)?
A process flow chart (PFD) shows the overall process of a plant. It represents the main equipment, such as reactors, heat exchangers and pumps, as well as the main streams (e.g. raw materials, intermediate products, end products). The PFD provides basic information about the process, such as temperatures, pressures and flow rates, but no details to pipelines or instrumentation.
A pipeline and instrument flow diagram (PID), on the other hand, shows the detailed presentation of the system. It contains all pipes, fittings, instruments and their connections. A PID provides precise information about the diameters of pipes, valves, measurement points and regulations. It is a detailed scheme that is used for installation, operation and maintenance of the plant.
What Function Do P&I Flow Diagrams Not Fulfill?
P&I flow diagrams do not fulfill the function of taking into account business management aspects or cost analyses. They are not intended to illustrate process technologies in detail or to plan production sequences. Furthermore, they are not suitable for training purposes for non-technicians, as they contain technical details and specific information that require in-depth specialist knowledge.
What Is Not Part of a P&I Flow Chart?
An P&I flow sheet does not include:
- Detailed process descriptions or production processes.
- Cost information or profitability calculations.
- Operating instructions or work instructions.
- Electrical circuit diagrams and cable routing.
- 3D models or floor plans of the plant.
What Are the Limitations of P&I Flow Diagrams?
P&I flow charts have the following limitations:
- They do not provide any information about the exact spatial arrangement of the components.
- They do not represent any process dynamics, such as the change in pressure or temperature over time.
- They do not contain any economic information or cost data.
- They are not suitable for training personnel who have no prior technical knowledge.
What Are EMSR Tasks?
EMSR tasks include the development, installation and maintenance of electrical, measurement and control technology in technical systems. This includes:
- Planning and implementation of measurement and control circuits.
- Monitoring and optimization process control.
- Calibration of sensors and measuring devices.
- Fault diagnosis and troubleshooting in EMSR technology.
- Security checks and documentation of EMSR systems.
What Are EMSR Positions?
EI&C points refer to the locations or positions within a system where measuring, control and regulation devices are installed. They are the points at which parameters such as pressure, temperature, flow or level are measured, monitored and controlled. These points are identified in the P&I flow diagrams by symbols for instruments, sensors and control devices.


Are you an engineer or designer looking for new challenges? With us you can expect a familiar atmosphere and exciting tasks!
View Job Ads Now!
